
Featured project 7 · JavaScript · Performance
k6 Performance Testing
Smoke, load, stress, spike and soak tests with Grafana k6 for a shop API kept in the repository: service level objectives as thresholds that fail the CI job, and a stress test that found a real bottleneck.

Purpose
Shows how I approach performance testing: one test per question, pass/fail criteria agreed up front, realistic workload models, and results that lead to a fix. The app under test, a small shop API, is part of the repository, so the tests never put load on someone else's server and every CI job measures its own copy.
Technology stack
| Area | Tools |
|---|---|
| Load testing | Grafana k6 2.3 (scenarios, executors, checks, thresholds, custom metrics) |
| Scripts | JavaScript ES modules (k6 runtime) |
| App under test | QuickShop: Node.js 24 HTTP API, no dependencies, with functional tests |
| Reports | k6 web dashboard (HTML), Markdown summary per run, JSON of every metric |
| Code quality and CI | ESLint, Prettier, GitHub Actions: lint, smoke gate, load/stress/spike in parallel, nightly soak |
Architecture overview
k6/tests/*.js     scenarios (who, how many, which executor) + thresholds (SLOs)
      │
k6/lib/flows.js   journeys browse() and buy(): checks, think time, business metrics
k6/lib/api.js     one function per endpoint, stable name tag per request
k6/lib/config.js  BASE_URL, PROFILE (ci | full), THINK
      │
QuickShop (app/)  started by each CI job; checkout limited by 8 "database connections"
Key engineering decisions
- SLOs per endpoint as thresholds (p95 per endpoint, error rate, checks, business metrics): a missed SLO exits with 99 and fails the job
- Visitors in a closed model (ramping-vus) and orders in an open model (arrival rate) in the same test; dropped iterations have a threshold
- One login per virtual user, a different test user per VU from a SharedArray, random think time
- Each test has a ci size for every push and a full size for a dedicated environment, side by side in the script
- The stress test asserts graceful degradation (every order placed or refused with 503, bounded wait), not the normal SLOs
Implemented features
- Five test types: smoke (gate), load, stress, spike and soak; soak samples the server's memory every 10 s
- Finding: past about 90 orders/s checkout queued without limit (p95 over 3 s and rising); fixed with load shedding, the slowest checkout is now 624 ms
- Regression demo: a 300 ms slower checkout passes every functional check but fails the checkout SLO (p95 425 ms vs 400 ms)
- Markdown result table on every CI run page; HTML dashboard and JSON as artifacts
- Design notes and 78 interview questions on performance testing and k6, linked to the code (Markdown + PDF)
Setup and execution
npm install
npm start                               # QuickShop on http://localhost:3000
k6 run k6/tests/smoke.js
k6 run k6/tests/load.js
k6 run -e THINK=0 k6/tests/stress.js
k6 run -e PROFILE=full k6/tests/load.js  # realistic size and duration
Sample test results
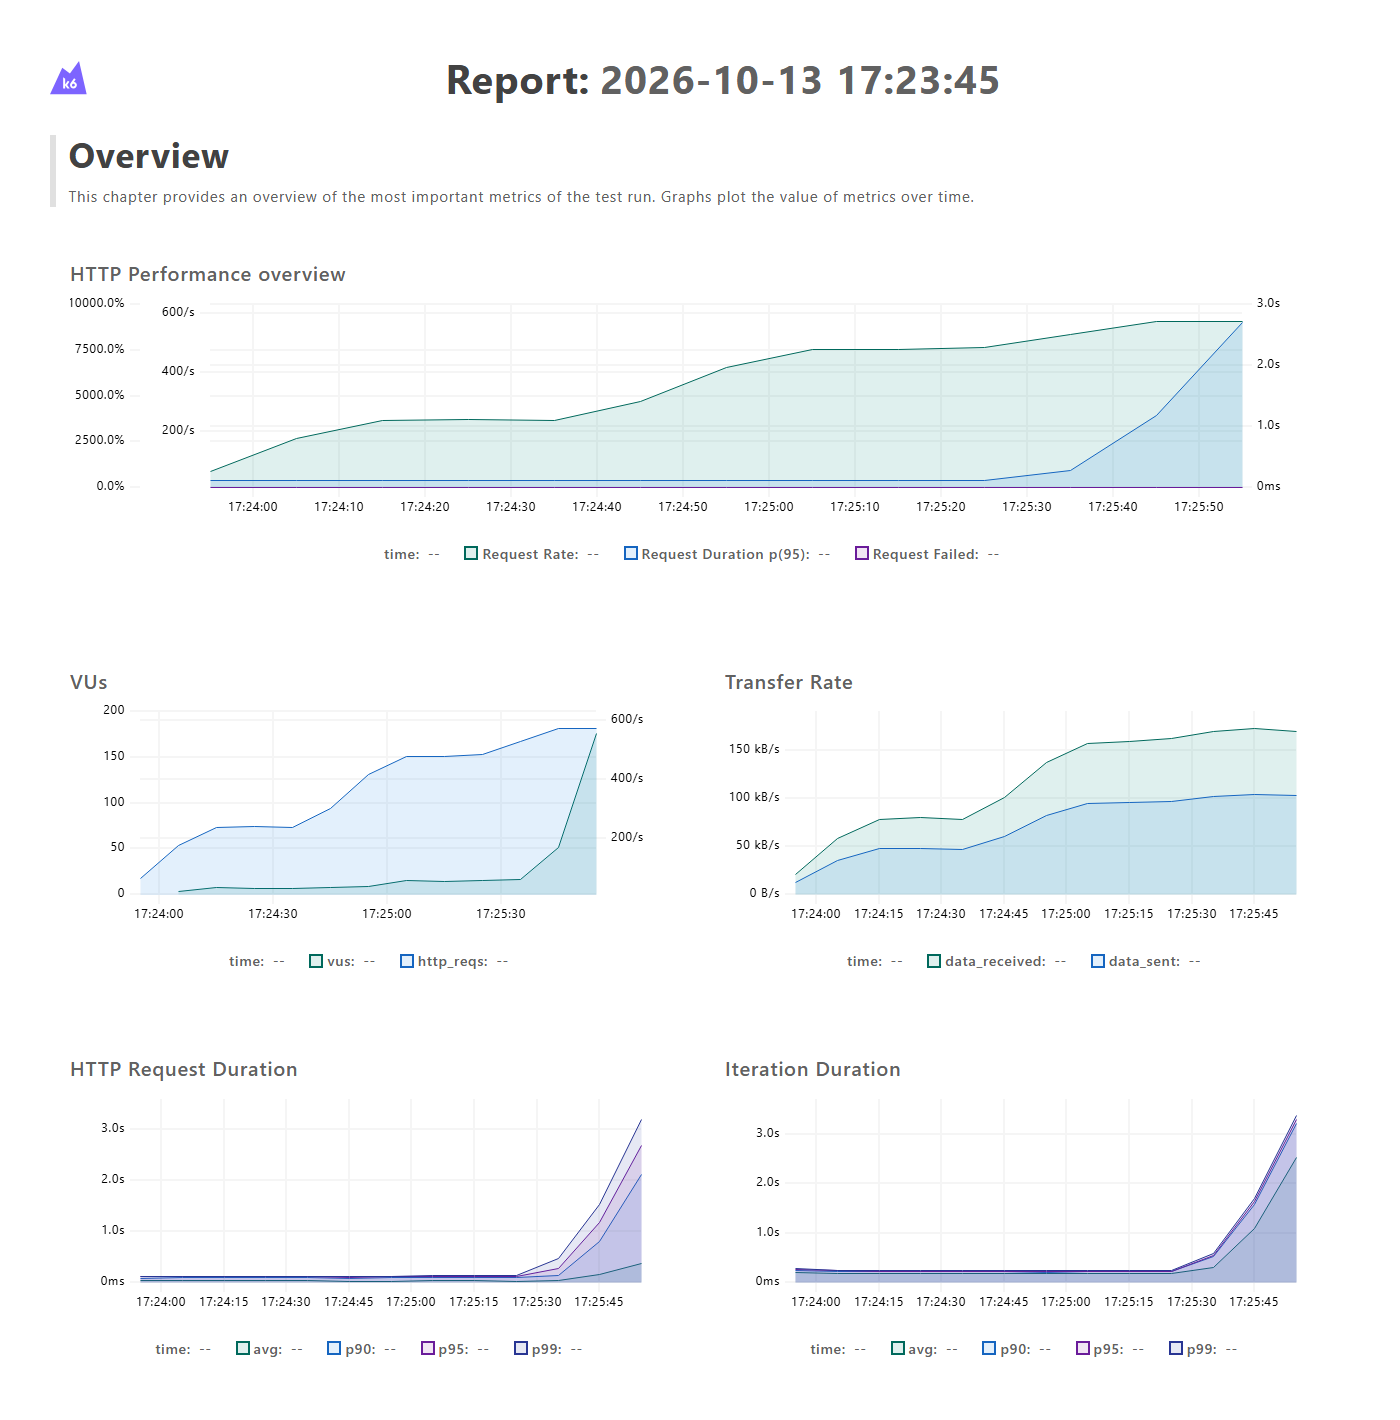
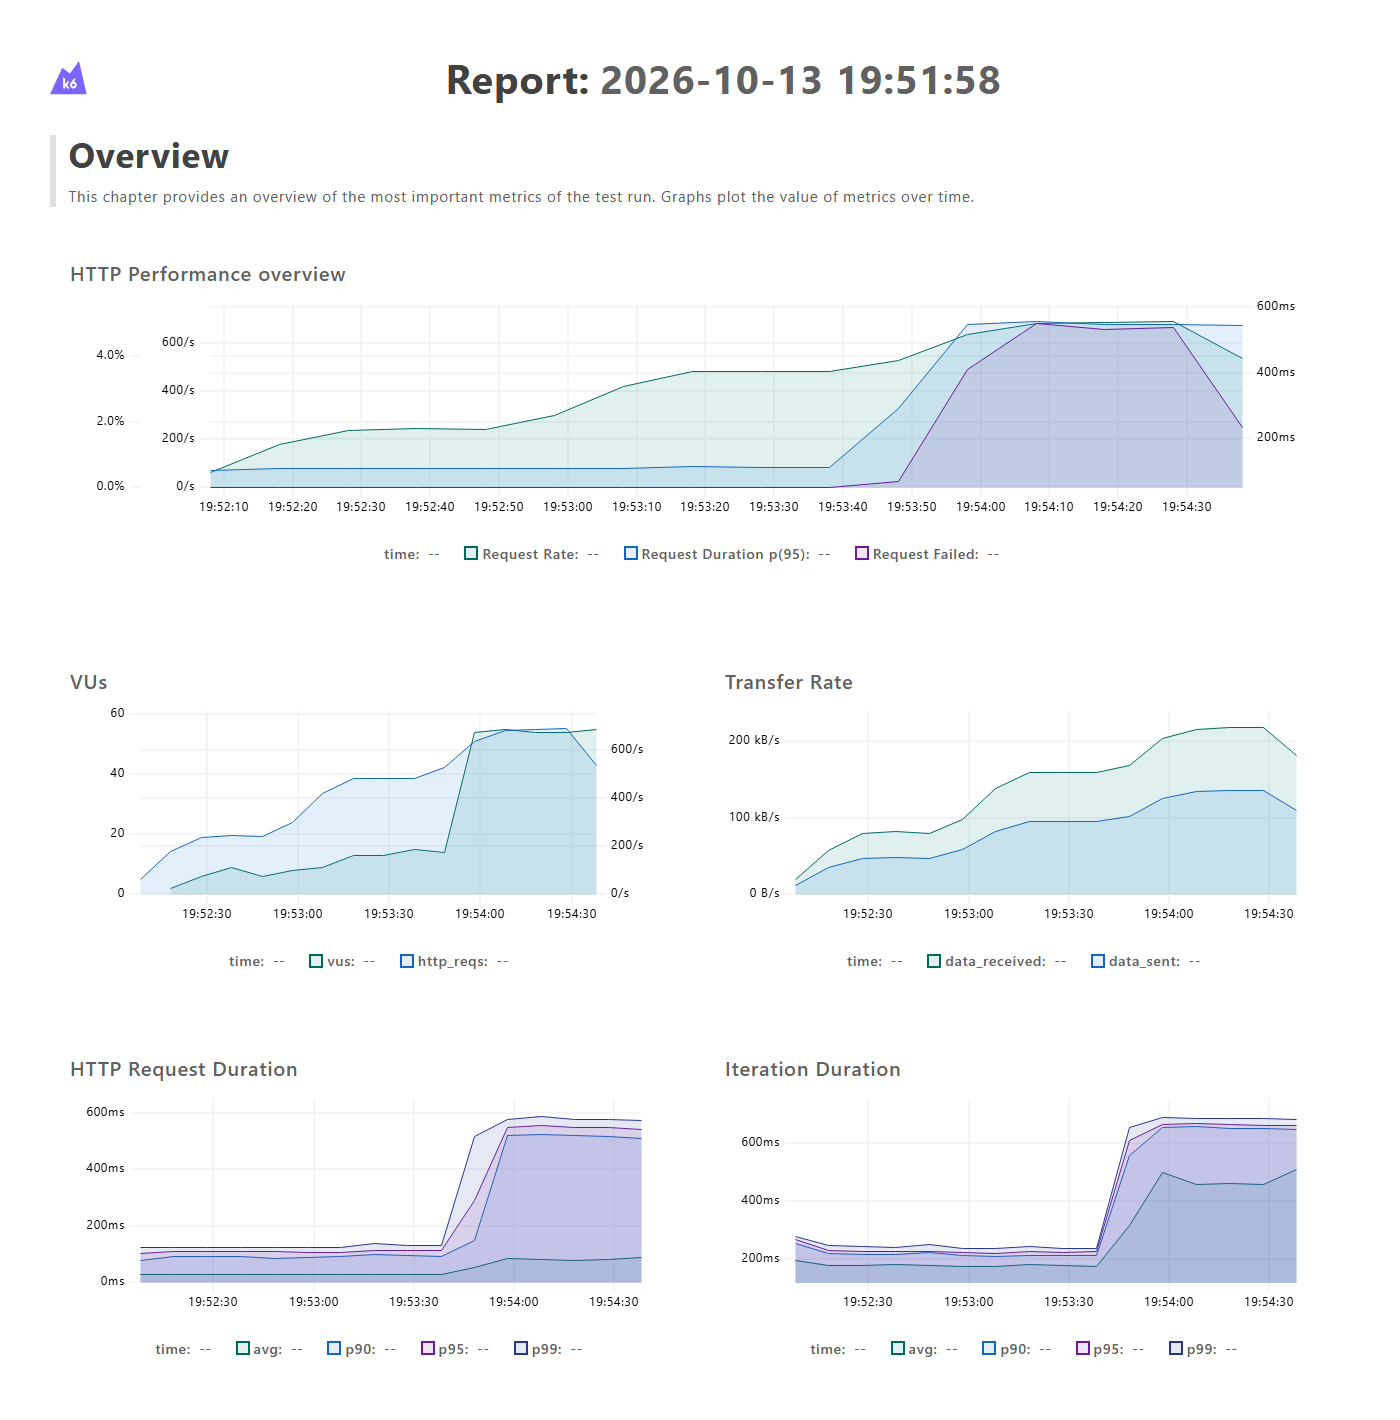
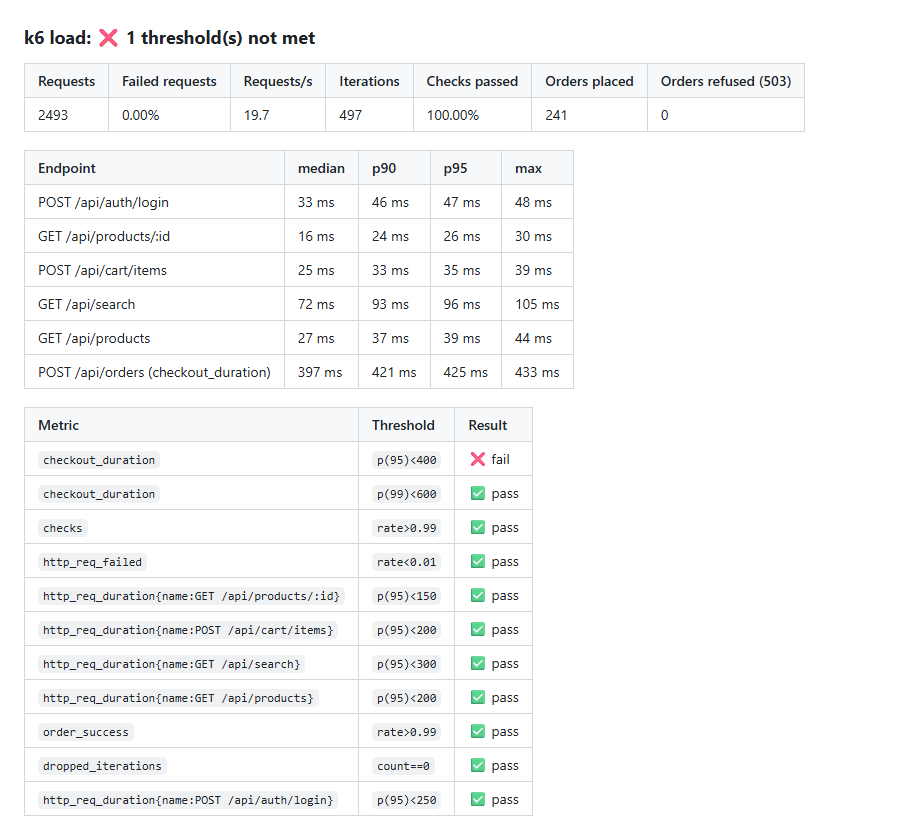
CI workflow
On every push and pull request: ESLint, Prettier and the app's functional tests, then the smoke test as the gate, then the load, stress and spike tests as three parallel jobs, each with its own copy of the app. The soak test runs nightly. Each job writes its result table to the run summary and keeps the HTML dashboard as an artifact.
Known limitations and future improvements
Limitations
- Shared CI runners are noisy: the CI sizes catch regressions; capacity numbers need dedicated load generators and a production-like environment
- The app under test is a demo with simulated latencies
Next steps
- Stream metrics to Grafana (Prometheus remote write) next to server metrics
- A k6 browser scenario for Web Vitals under load